Our microbial future

Modeling the
invisible world
of microbiomes.

µHub collects microbial relative abundance data from labs worldwide, to model community dynamics and delivers insights into their interactions. With optimization-based, generalised Lotka–Volterra equations, it uses complex and modern algorithms, whilst staying completely free to contributing labs.

3Contributing labs
9Taxa tracked
36Observations
0Cost to users
igLVAlgorithmic framework
The pipeline

From sequencing run
to global insight.

01 - Labs
Sequencing microbiomes
Research labs run 16S rRNA and metagenomics experiments and therefore already generate relative abundance data. This means no new protocols, nor new equipment needed. Businesses engaging in R&D are of course welcome as well.
02 - Upload
Upload to µHub
Sending the data in is easy, simply provide relative or absolute abundance values. We accept a plethora of species and datasets with any number of species. Just keep in mind that larger species counts require more computation. If your have a dataset in mind, upload it now.
03 - Compute
Dynamics computed
Using new algorithms, we calculate what is going on in your samples and provide your with those information.
04 - App
Public engagement with real models
Your data can help to establish an application aiding people to focus and awakening their interest in YOUR research. Do not worry, no one will have access to your specific sampling results, we create estimates of absolute microbe numbers and educate about the organisms.
Why µHub

The microbiome modeling problem, no more.

Many institution cannot afford to investigate the full interactions between microorganisms in samples of out diverse ecosystems. By collecting from hundreds of labs, µHub achieves geographic and ecological breadth that is otherwise unseen, using this to build a database that expanding over time.

Zero marginal cost to contributors as you upload data you are already generating!

µHub · Live map
Düsseldorf Cologne Bonn Monheim Jülich
3Active labs
9Taxa
180Samples
Get started

Want to
contribute?

Join others to be one of the first labs to contribute and benefit from µHub to model your microbiomes.

Download

µHub, completely
free to use.

No subscription. No ads. µHub is free for users and academic contributors, because the value is from the collected data, and what this brings for OUR future.

Example simulation

Insights
Features

Everything we provide now
and in the future...

Interactive LV simulator
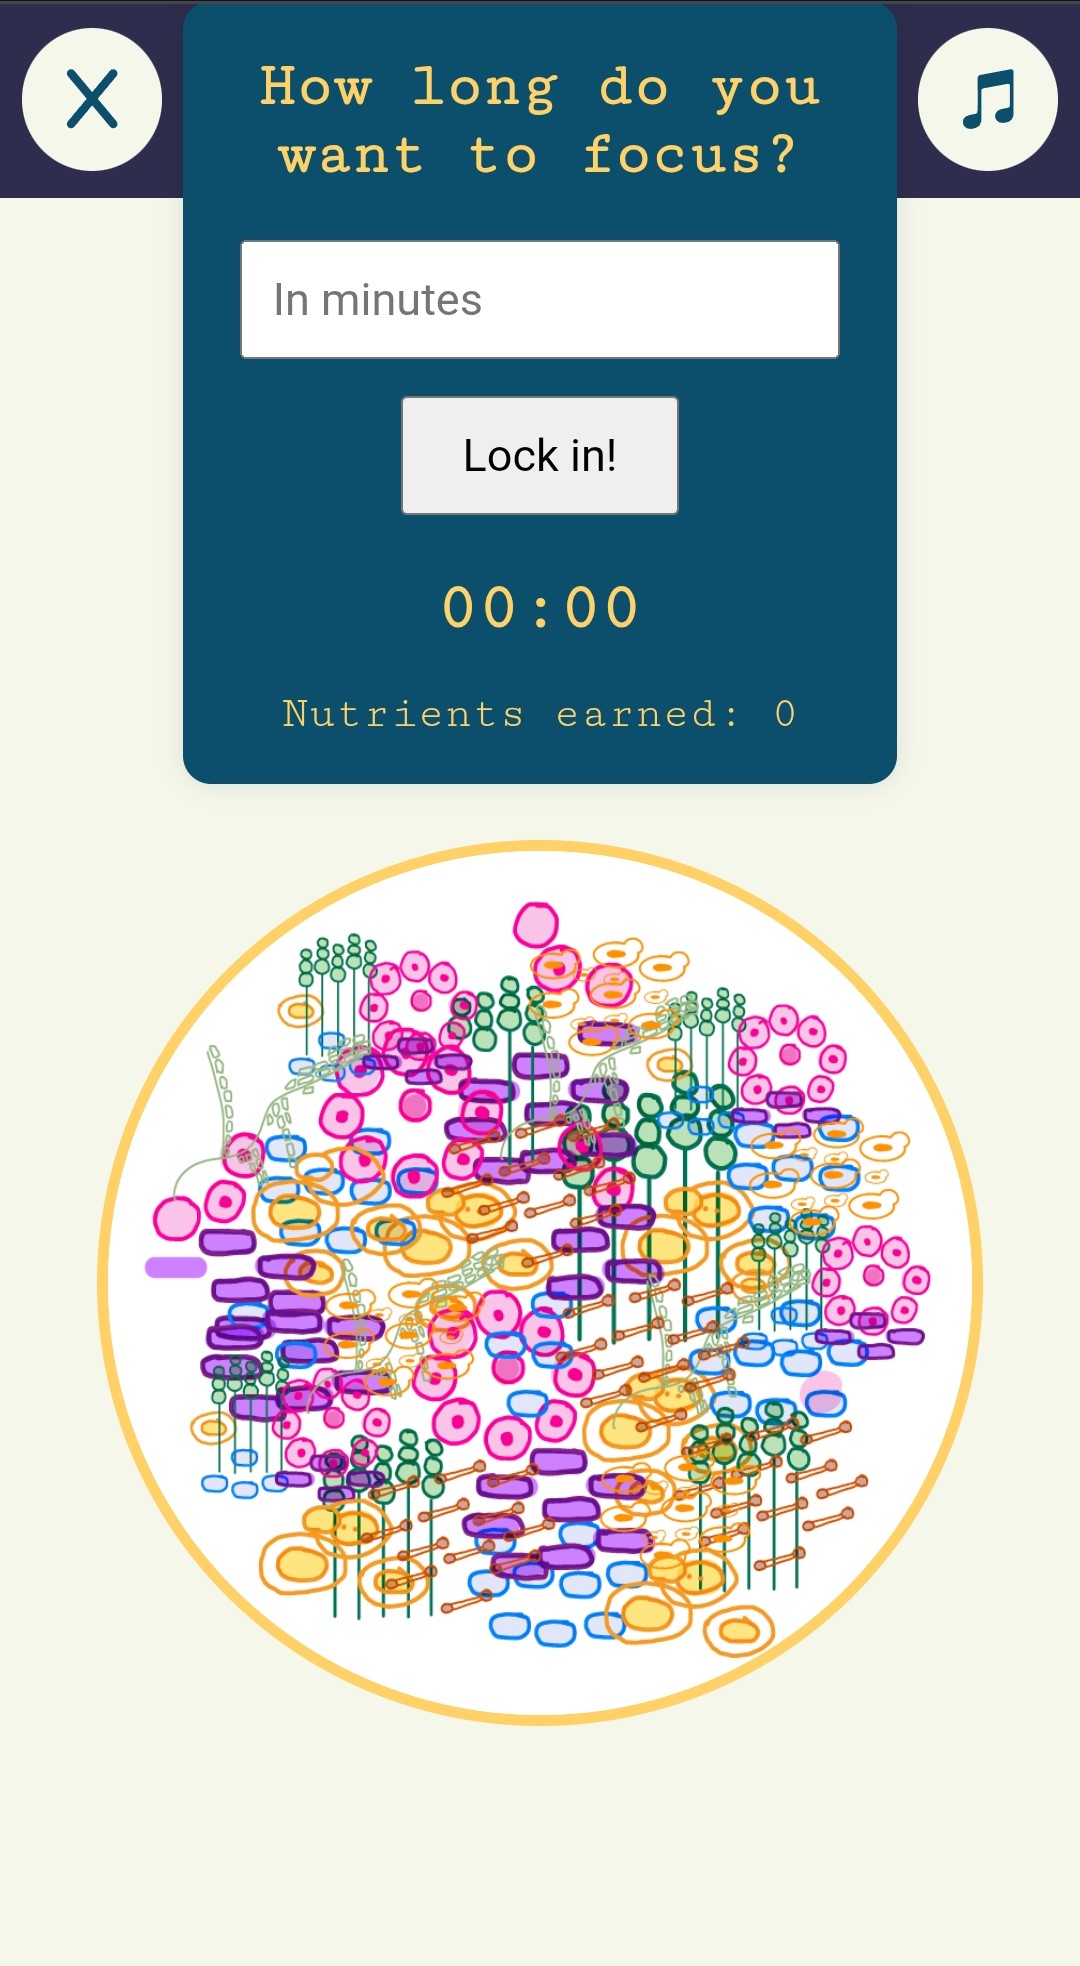
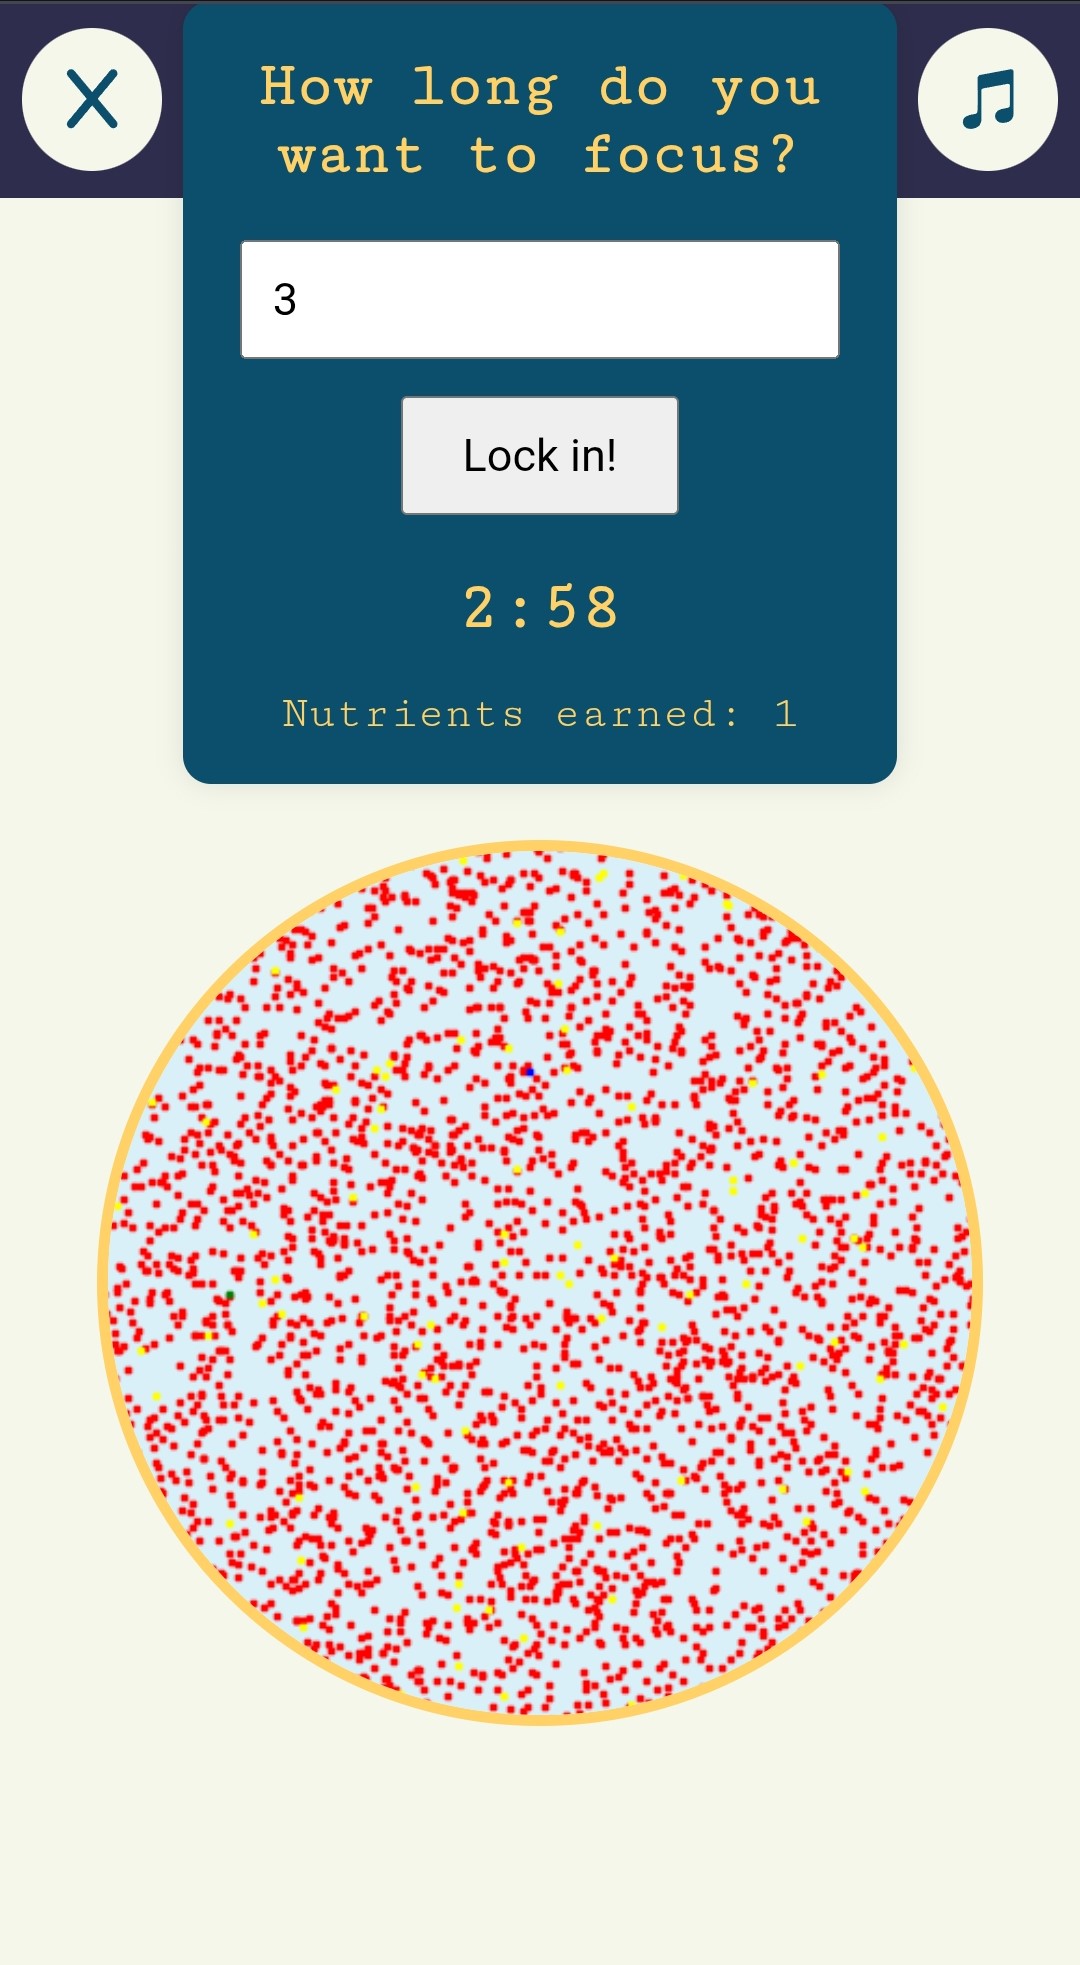
The main feature of our app is the Lotka-Volterra simulator, which incentivises you to focus whilst modeling real-life microbiomes. Choose the combination of your microbes and the time and get information on how they interact!
Data library
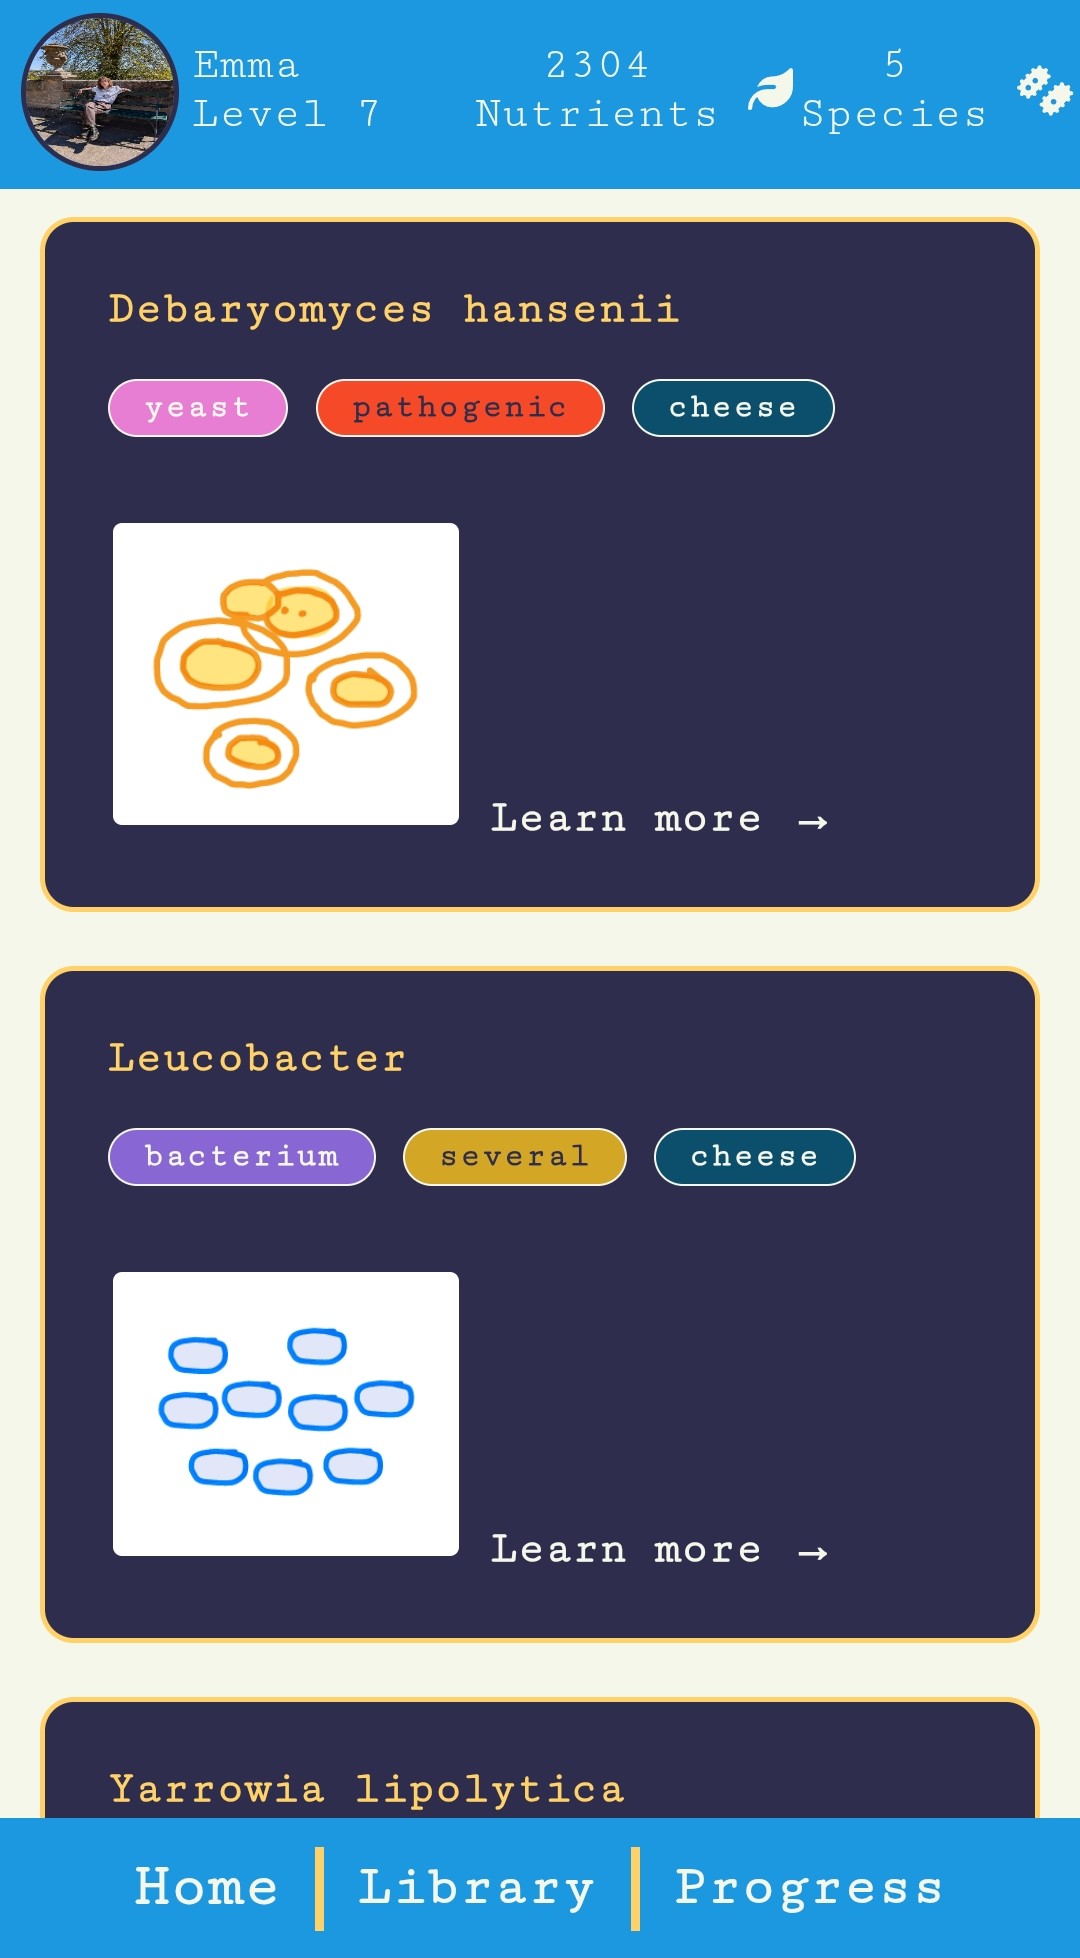
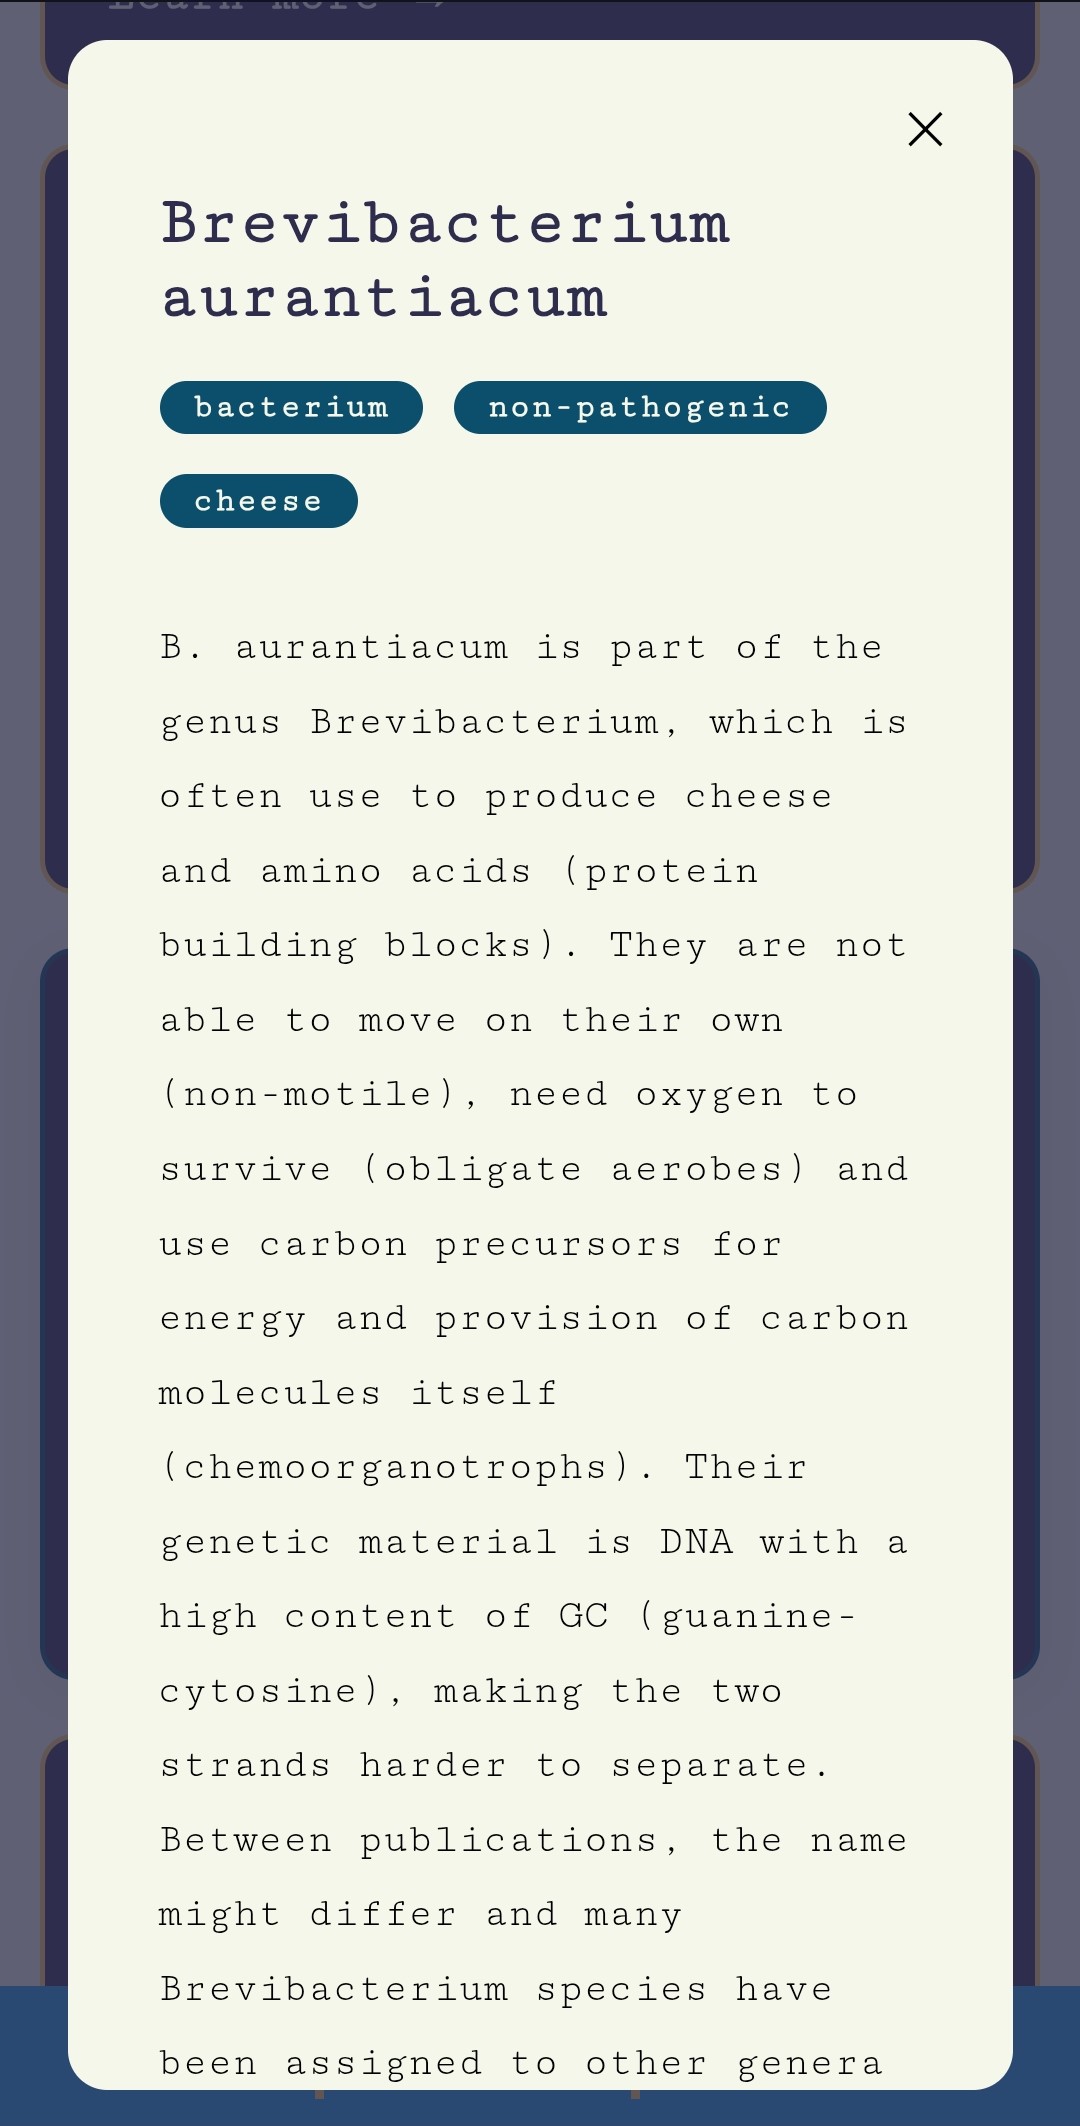
For each dataset added to our database, we seek to add easily-digestable information about the species to our library. Your modeling helps us with their interactions.
Privacy-first data handling
All uploaded data is anonymous to the user. Labs retain full ownership. Information visible for users has already been and visualized, so no one can extract your research from it.
Built for Open Science
Designed to support transparent and reproducible microbiome research with open access to simulations, educational resources, and community knowledge.
Live global microbiome map
Discover where microbiome research is happening and explore publicly available datasets from around the world.
Alerts and weekly digest
Stay informed about new datasets, platform updates, and the latest developments in microbiome research. µHub could act as a personal tracking tool in the future.
FAQ

Common questions

Why is µHub completely free?
μHub is free for researchers, students, and the scientific community. Our goal is to make microbiome modeling accessible while fostering collaboration and knowledge sharing.
What data format do I need?
Our calculations are based on abundance data, which we can interpret even if it is "only" relative. The data should be provided as a .csv (our comparable file type), with rows = timepoints and columns = species. Please also include or provide labelling for the specific species and be open to provide specifications to data origins.
Which microbial ecosystems does µHub cover?
μHub currently focuses on microbial ecosystems supported by our available datasets (cheese dataset). We will be continuously expanding the platform to include additional environments, like the human gut, soil, marine, and other microbiomes. This will be part of later updates of the app.
How does the LV simulator work?
The μHub simulator is based on the Lotka–Volterra model for microbial interactions. Select a dataset, configure the simulation parameters, and define the simulation duration. The platform predicts how microbial populations evolve over time and visualizes their interactions, allowing you to explore different ecological scenarios. The longer you focus, the more accurate the model will probably get!
The Science

Inferring microbial interactions with dynamic models.

Our work has adapted theoretical models to be able to infer microbial interactions from real world datasets. Using our model to understand complex microbial relationships, industrial processes can be optimized and efficiency can be improved.

Generalized Lotka Volterra Relative abundance data Iterative network inference Low Carbon Mobile Cloud Computing
Core idea

Interactions are
everything.

Microorganisms do not exist in isolation. They exist in complex microbial interaction networks. Interactions between two species can be classified into different types and can have a negative, positive, or no impact on the species involved.

Identifying these interactions is not at all easy, and as more species are added to the mix, the problem gets increasingly complicated.

Visualizations of different symbiosis types.

Types of microbial interactions

Core concepts

What we do.

Generalized Lotka Volterra
These equations were originally used to describe predator-prey dynamics. In the generalized form, they can be used to model dynamics of many species, and for all the interaction types. These equations still have many drawbacks when applied to real world data, but don't you worry, this is our problem to solve!

\[{dx \over dt}=\alpha x-\beta xy\]

\[{dy \over dt}=\delta xy-\gamma y\]

Relative abundance data
Metagenomics and 16S rRNA sequencing have allowed for the monitoring of microbial communities. The labs we are cooperating with use a number of pipelines to facilitate the task of extracting relative microbial abundances from raw data.
Visualizations of datasets needed for modeling.
How do we then convert this relative abundance data into an understanding of interactions?
Iterative network inference
A novel approach to predict growth rates and interaction strengths of the different community members using large time series relative abundance datasets. The functions used can be computationally intensive, especially for systems with many species and in dense time series datasets.
Abundance over time plot received after performing the modeling.
Low Carbon Mobile Cloud Computing
The computational tasks required for our model are offloaded to personal mobile phones. We cluster groups of devices from users of our app to perform a parallel computing task of inferring these interactions.
Visualizations of parallel computing via several phones.
Contact us!

What can you do with this
information?

Microbial interactions play a fundamental role in industrial processes. This includes applications in biofuel production, bioremediation, and food processing. Our current partners are in the food processing industry and have used the learned microbial interactions to improve the food quality and safety by using optimized starter cultures in fermented foods.

Our vision

From first
launch to home
sequencing.

Our 5-year plan:
Establishing µHub for wide-spread microbial modeling and an application increasing focus and knowledge about microbiology.

Even further into the future:
Home sequencing for everyone and µHub as an analysis and interpretation tool for personal microbial ecology.

Timeline
2025

The idea

We saw that only few labs and businesses used the recent advances in modeling algorithms. This seems to be related to the lack of experience with those and of computing power for more complex datasets.

Our origins.
May 2026

Interest validation

Many students complain about their lack of focus whilst studying. We asked how this could be imrpoved. Additionally, especially younger pupils have no connection to microbiology.

More than 50 people responded. The majority is distracted by their phone during studying. Many show weak connection to microbiology as of now but an interest to explore.
July 2026
Now

App prototype

Using latest modeling approaches, responsive web design and example data, our developers sought out to combine microbial modeling with an educational focus app.

Iterative, generalized Lotka-Volterra models for precise modeling requiring a lot of computing power.
End of 2026

Widening database, launch and first commercial licenses

Curate several microbiome interaction parameter databases from labs, focussing on gut microbiome. First data licenses sold to probiotic and food science companies, whilst information for participating labs remains free. Followed by expansion.

Target: 30 contributing labs, up to thousands of samples of at least 5 distinct microbiomes. Starting with cheese, the human gut, soil, etc.
2029

Personal microbiome integration

Integration with low-cost mail-in sequencing kits. Users link their own data to personalise the simulations run on their device, allowing for insights into individual ecology.

Cooperation with e.g. dental hygiene analysts. Pricing of less than 30 euros.
2030s

Home sequencing era

Sequencing technology has gotten more affordable. If portable methods reach consumer pricing, µHub would the first step in analysis and interpretation. Everyone can be given a real-time outlook into their own microbial ecology, modeled against the world's largest citizen-contributed dataset.

For everyone!
Business model

A circular
data ecosystem.

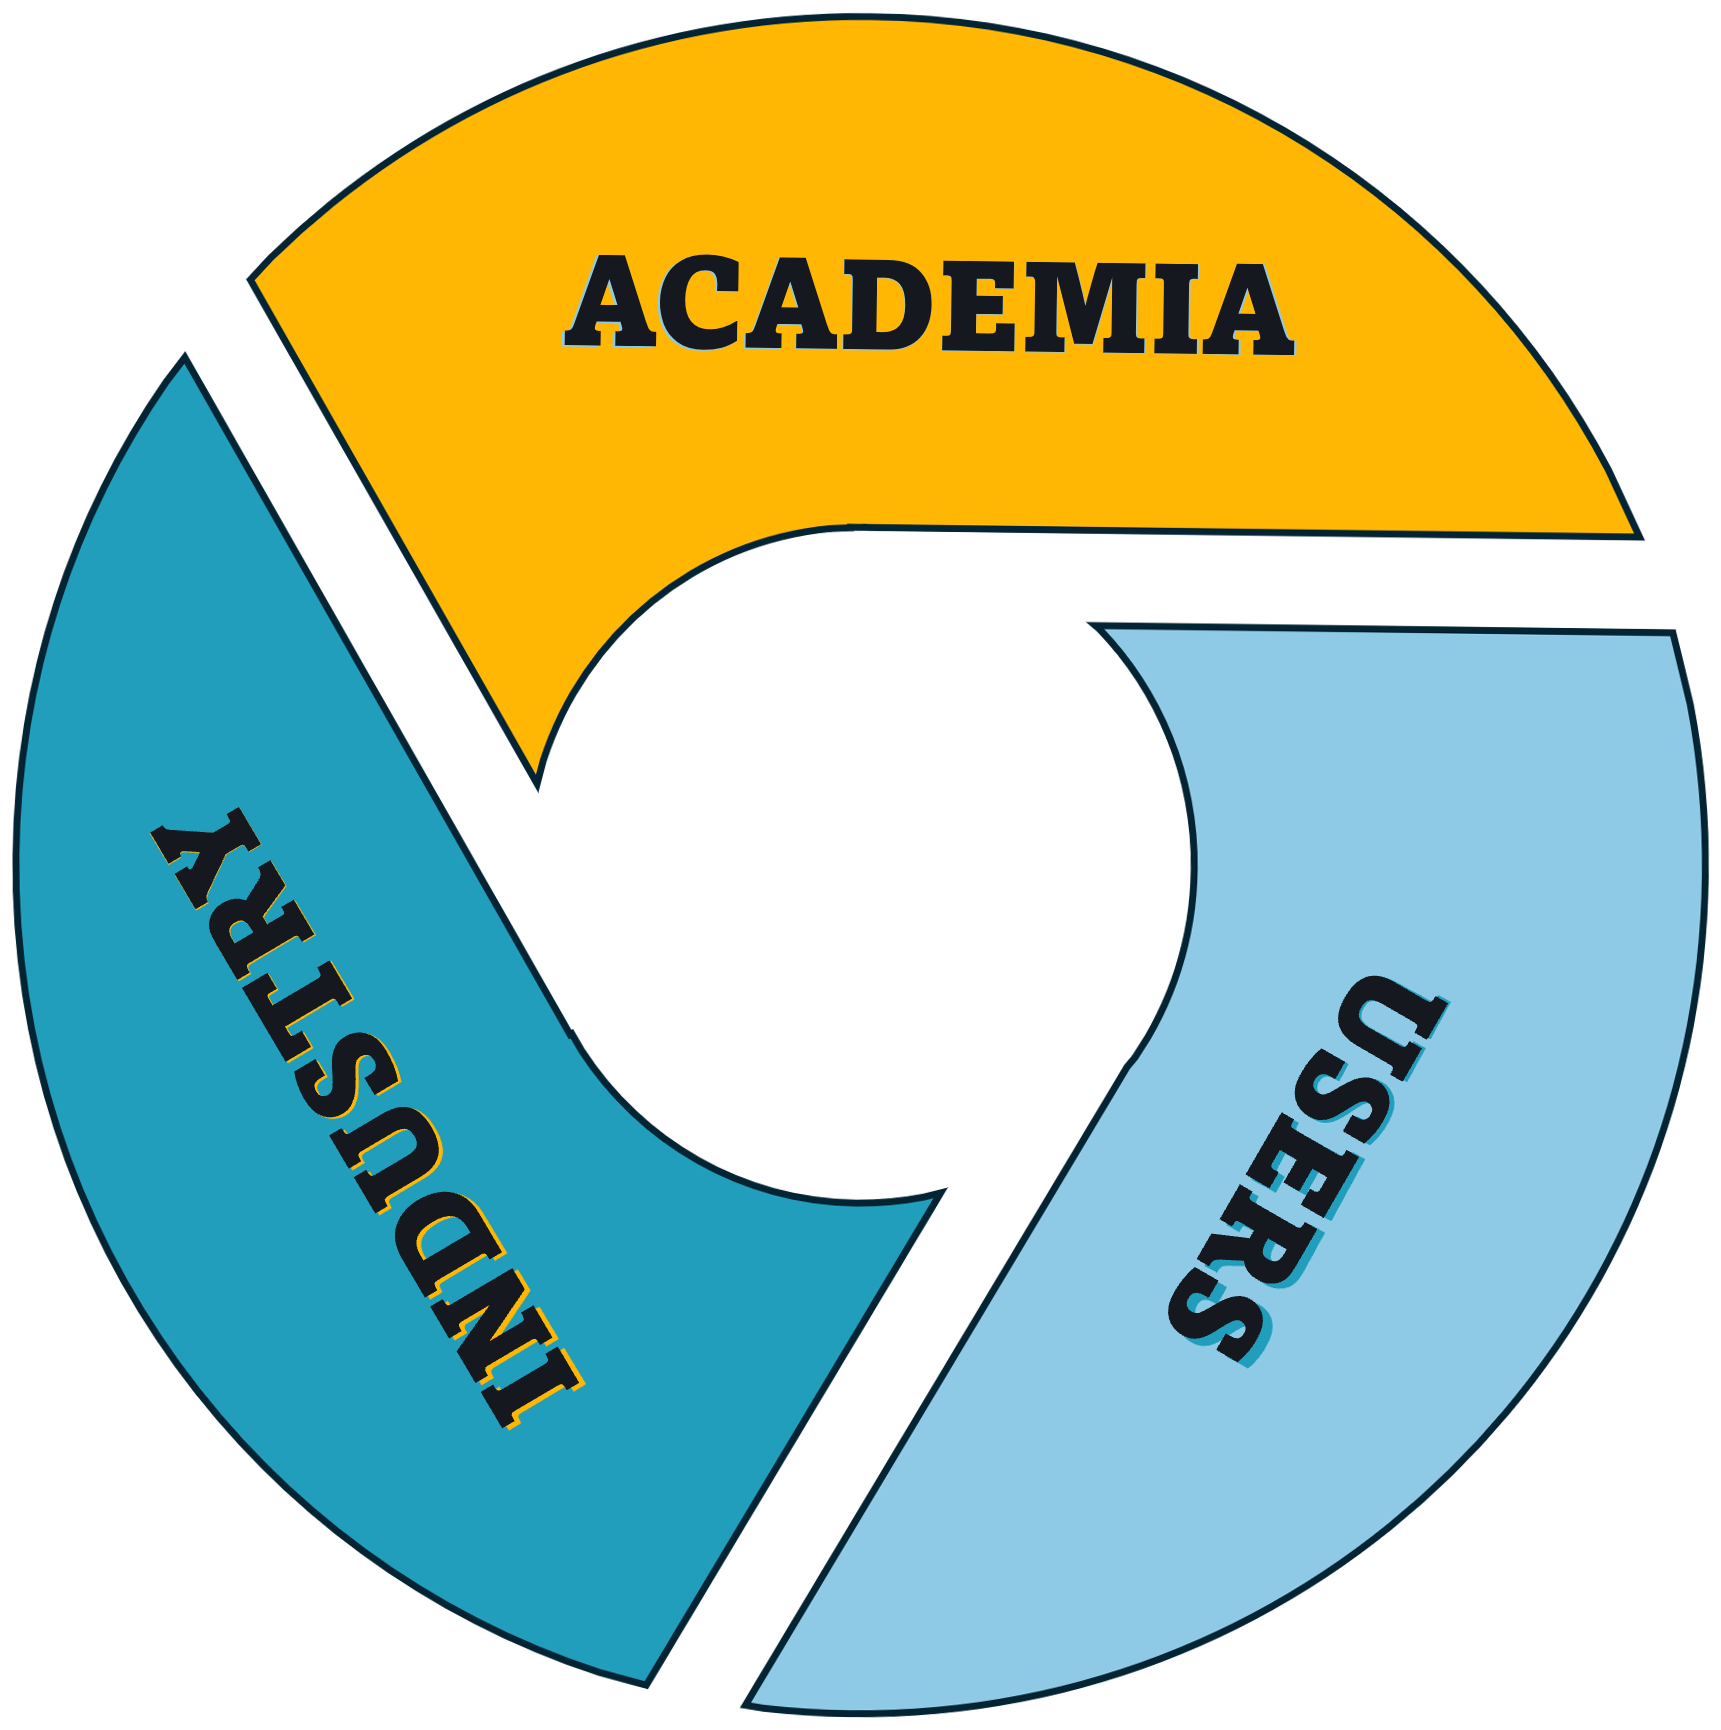
Three stakeholders. Each contributes AND receives something benefitting their specific position, as well as overall science and public.
Stakeholders

Who participates.

Academia and labs
What they contribute
Time-series microbiome data
Labs contribute raw microbial abundances data, generated from relevant experiments. This requires no new protocols and can therefore be directly integrated into the ordinary workflow.
What they receive
Academic access to µHub's microbial interaction database, yielding information generated from their samples which can directly be used in (further) research.
Users
What they contribute
Simulating
During each focus session, your device runs microbial interaction simulations in the background, directly contributing to science. This is voluntary, transparent and in your control.
What they receive
A motivation to focus and discover a personalised microbial visualisation after every session. Learn about the species living in your ecosystem. Eventually: personal gut health insights linked to your own sequencing data.
Industry and companies
What they contribute
Direct revenue
Culture manufacturers, large-scale dairy producers, food science firms and others pay for access to µHub's curated database of microbial interaction data. If interested, private labs can also provide their own, specific datasets.
What they receive
The largest standardised, simulation-backed microbial interaction dataset available, all from valid, academic data. This is exactly what they can use for further research and product development.
Competitive position

Why now. Why µHub.

Market tailwind
The food industry's demand for fermentation and culture development is growing at 6.7% annually. Probiotic supplements are becoming more and more common. We can connect up-to-date research with recent trends.
Unmet need
Modeling of microbial interaction data at this scale is not feasible for many labs. The ones that do are in single institutions with limited resources. Our platform combines this with citizen-scale computing power to model microbial interactions dynamically, while also providing something for the general public.
Interest of public

Our surveys show the need and interest of a focus app of this theme:
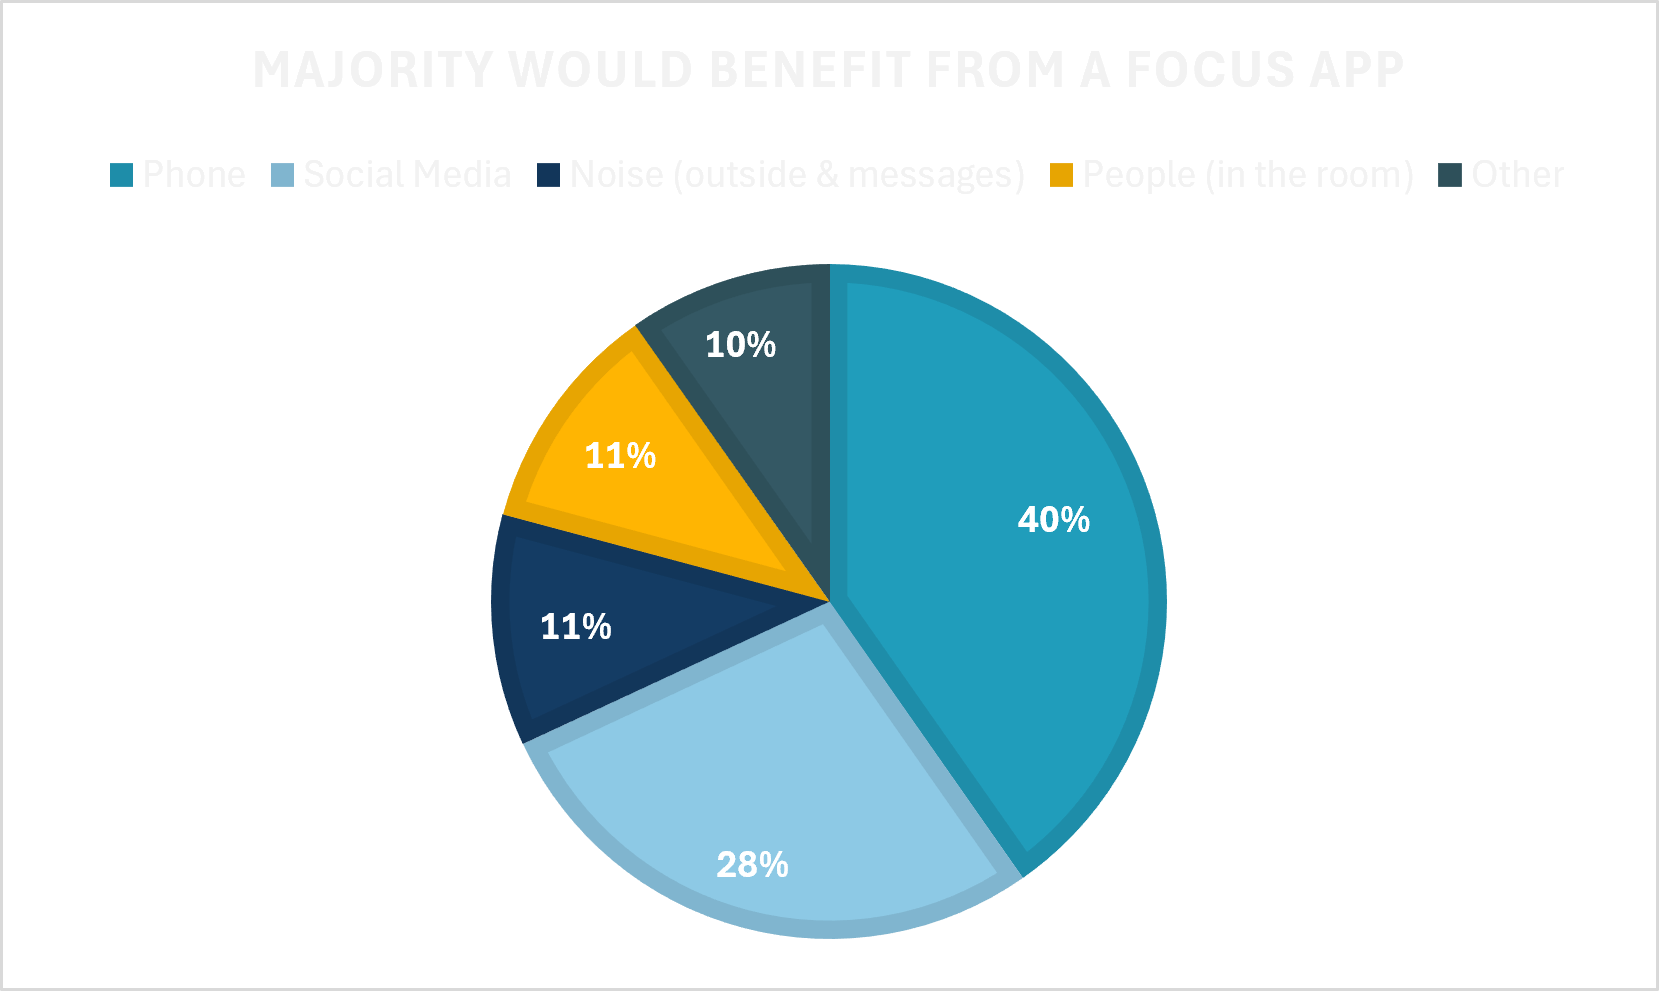
Barplot showing that most students consider their phone to be most distracting.
The team

Built by four QBio students at HHU Düsseldorf.

µHub is a project developed in the 2026 for the microbial ecology course of Quantitative Biology. The team combines expertise in dynamical systems modelling, data science, wet lab biology, and science communication.

@Anja Tißen
Get to know us!
Profile picture
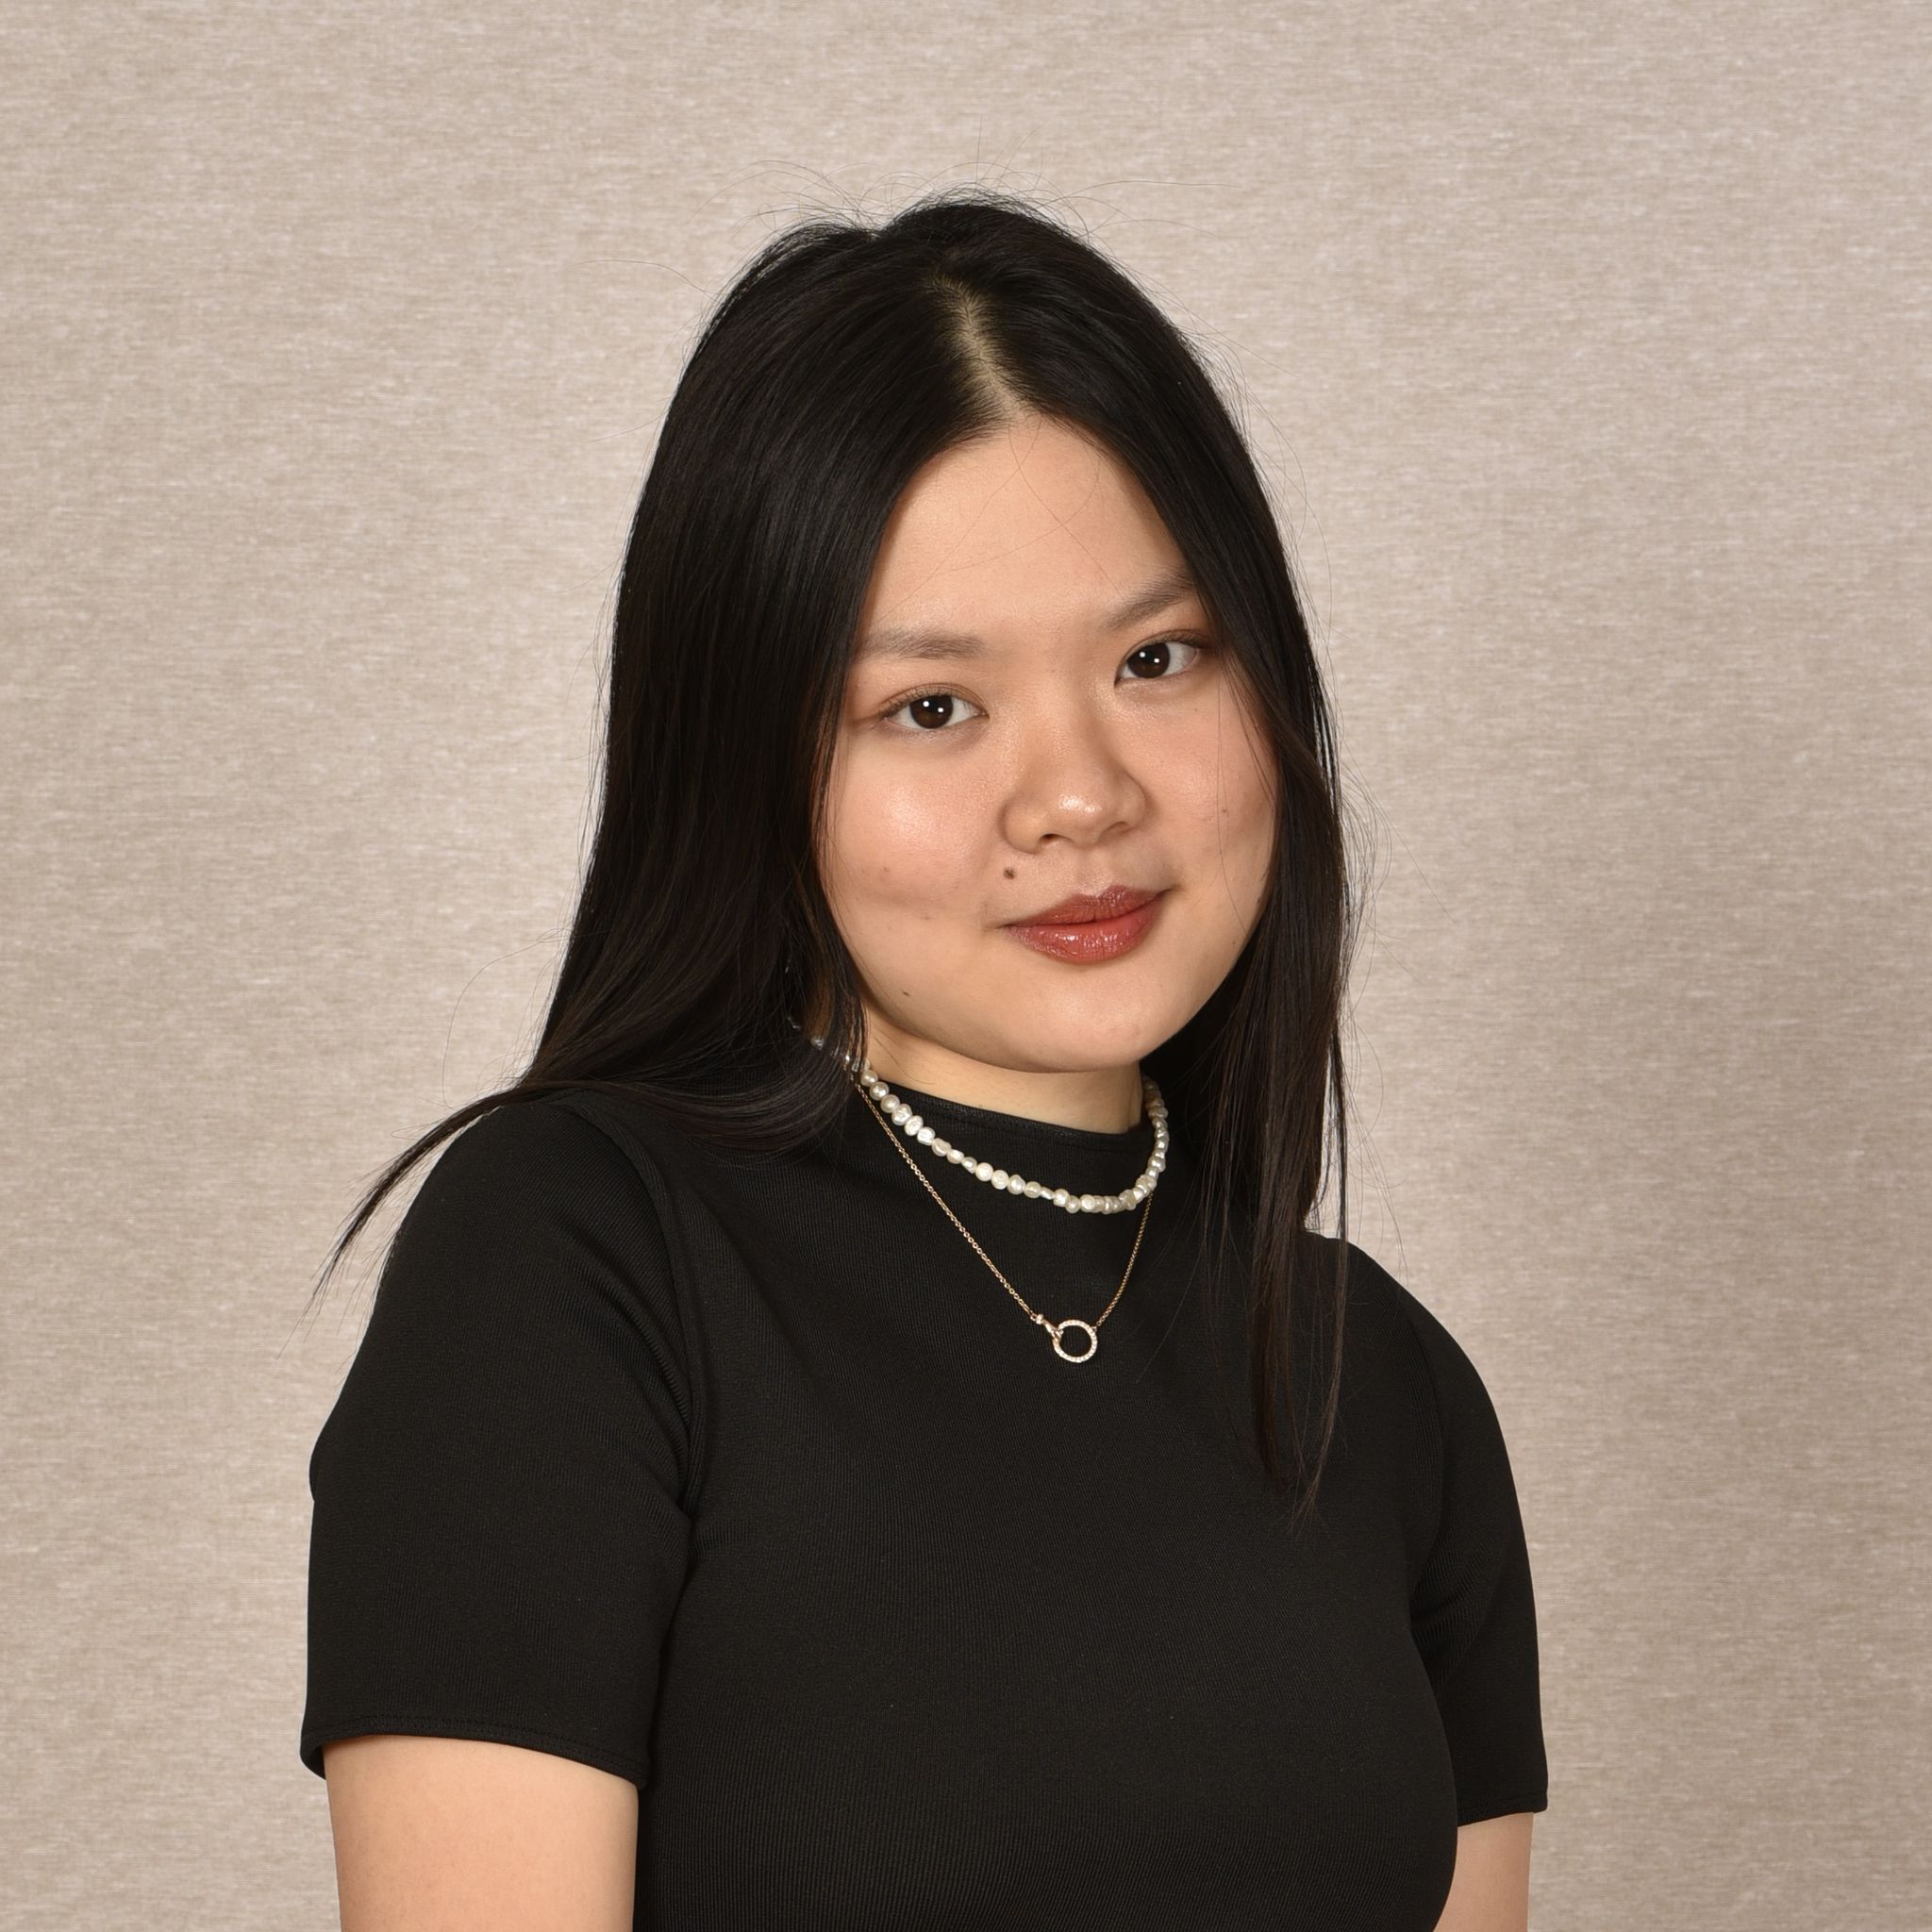
Nguyen Thuc Anh (Mimi)
Research & Development
As a student of Quantitative Biology, Mimi learned that our rate of biological data acquistion has greatly outpaced our ability to extract valueble information. She wants to be able to contribute the developing new computational methods which enable more rapid data analysis. At μHub she can do exactly that.
Macrotrachwlla quadricorniferaCaenorhabditis elegansLeast squares
Profile picture
Emma Filthaut
Software-Engineer
Whilst her focus during school was always on scientific subjects, she decided she would want to do something more practical. So she worked on archeological dig sites for a year. This was enough to realize that she was missing something and therefore she started Quantitative Biology, for an interdisciplinary connection of what she loves.
Clostridium botulinumDrosophila melanogasterPrincipal component analysis
Profile picture
Nina Wewers
Webdesign + Market analysis
Fascinated by science from an early age, Nina chose to study Quantitative Biology after graduating from school. While she enjoys exploring scientific questions, she has also always been passionate about organizing projects, coordinating teams, and transforming ideas into meaningful solutions. At μHub, she contributes across multiple areas, helping shape the platform from concept to implementation.
CyanobacteriaDrosophila melanogasterK-means clustering
Profile picture
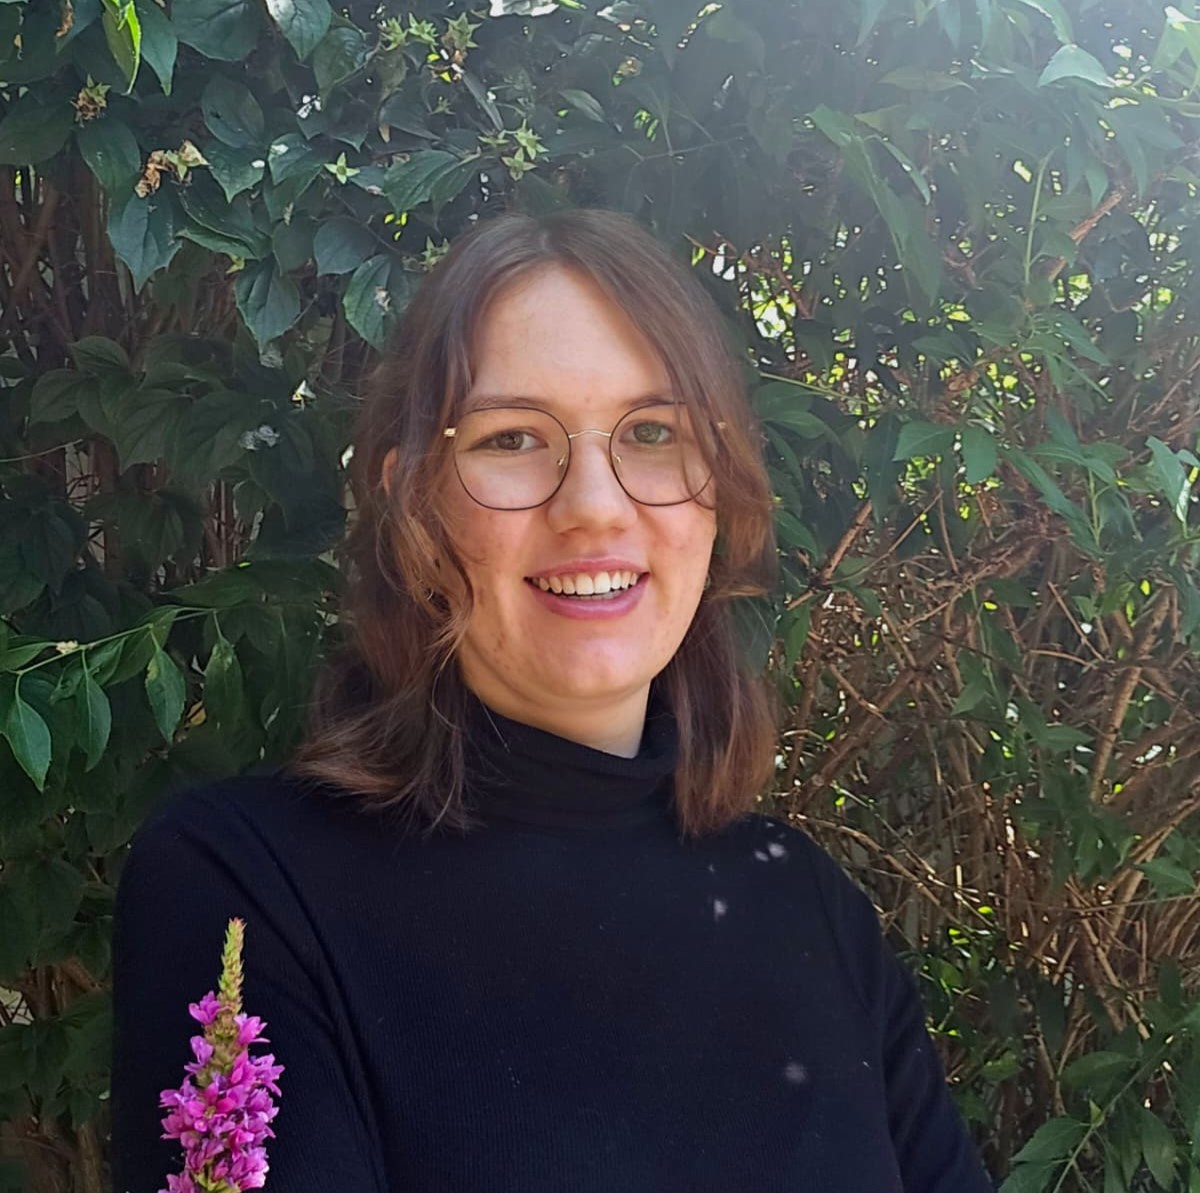
Sahanmi Peiris
Business consultant
Sahanmi has been captivated by biology ever since her high school days, which naturally led her to pursue Quantitative Biology as her field of study. She thrives on hands-on lab work, running experiments and digging into the details of how things function. At μHub, she focused on developing the business concept behind the project, helping turn the initial idea into something practical and workable.
Chromobacterium violaceumArtemia salinaNeural Networks
Supervision

Academically supported.

OE
Prof. Dr. O. E.
He leads the Institute for Quantitative and Theoretical Biology at HHU Düsseldorf and researchs on metabolic network modelling, dynamical systems in biology, and quantitative approaches to systems biology. This is also taught in QBio course and used as the theoretical foundation on which µHub is built. He advised during the development of the modeling framework.
GG
Prof. Dr. G. G.
Leading the the ICIB at HHU Düsseldorf, his focus is on cell interactions needed for morphogenesis, communication and root development. He gave advice for possible candidates of interest and where to find datasets to use.
FS
Dr. F. S.
A professor of Quantitative and Computational Biology and Mathematics at USC. His research and models made the initial development of µHub possible. Additionally, he was open to answer arising questions.
Contact

Get in touch.

Email
kontakt-mhub@m2ef.com
Institution
Heinrich-Heine-Universität Düsseldorf
Course
Quantitative Biology
Address
Universitätsstr. 1, 40225 Düsseldorf

Send a message